Optically Excited Thermography OTvis
Ask for a priceSpecification
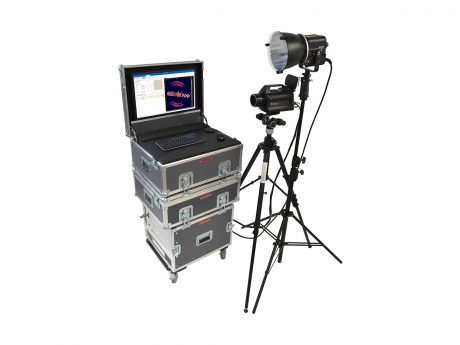
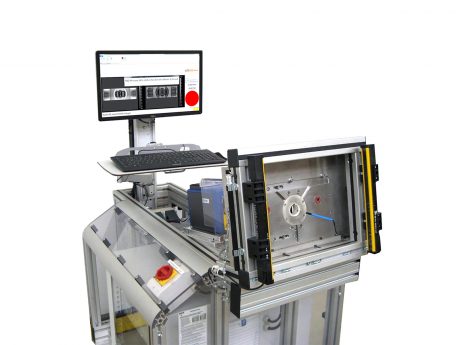
- Software: The comprehensive acquisition and evaluation software with project tree and script interface, especially suitable for OTvis multi-frequency measurements.
-
Applications:
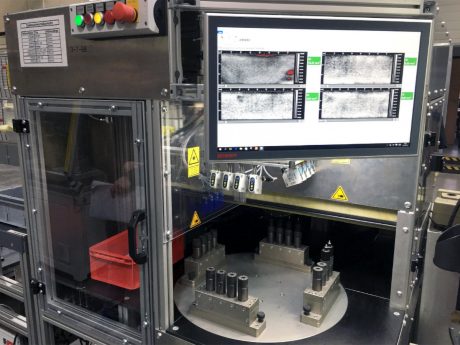
Testing of CFRP/ other fibre composites (delaminations, impacts, inclusions and porosity, bonding of inserts, resin/fibre content, preform analysis, fibre direction determination…)
Leather (inclusions, folds, repairs)
Corrosion testing
Wall thickness measurements
Testing of bonded joints
Testing of plastic welded joints
Rotor blade testing of wind turbines
Description
Optically Excited Thermography OTvis
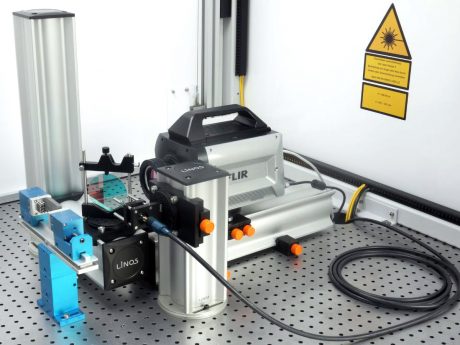
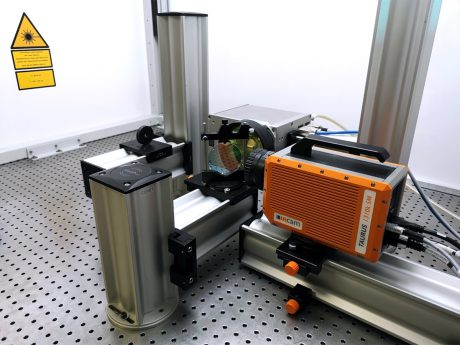
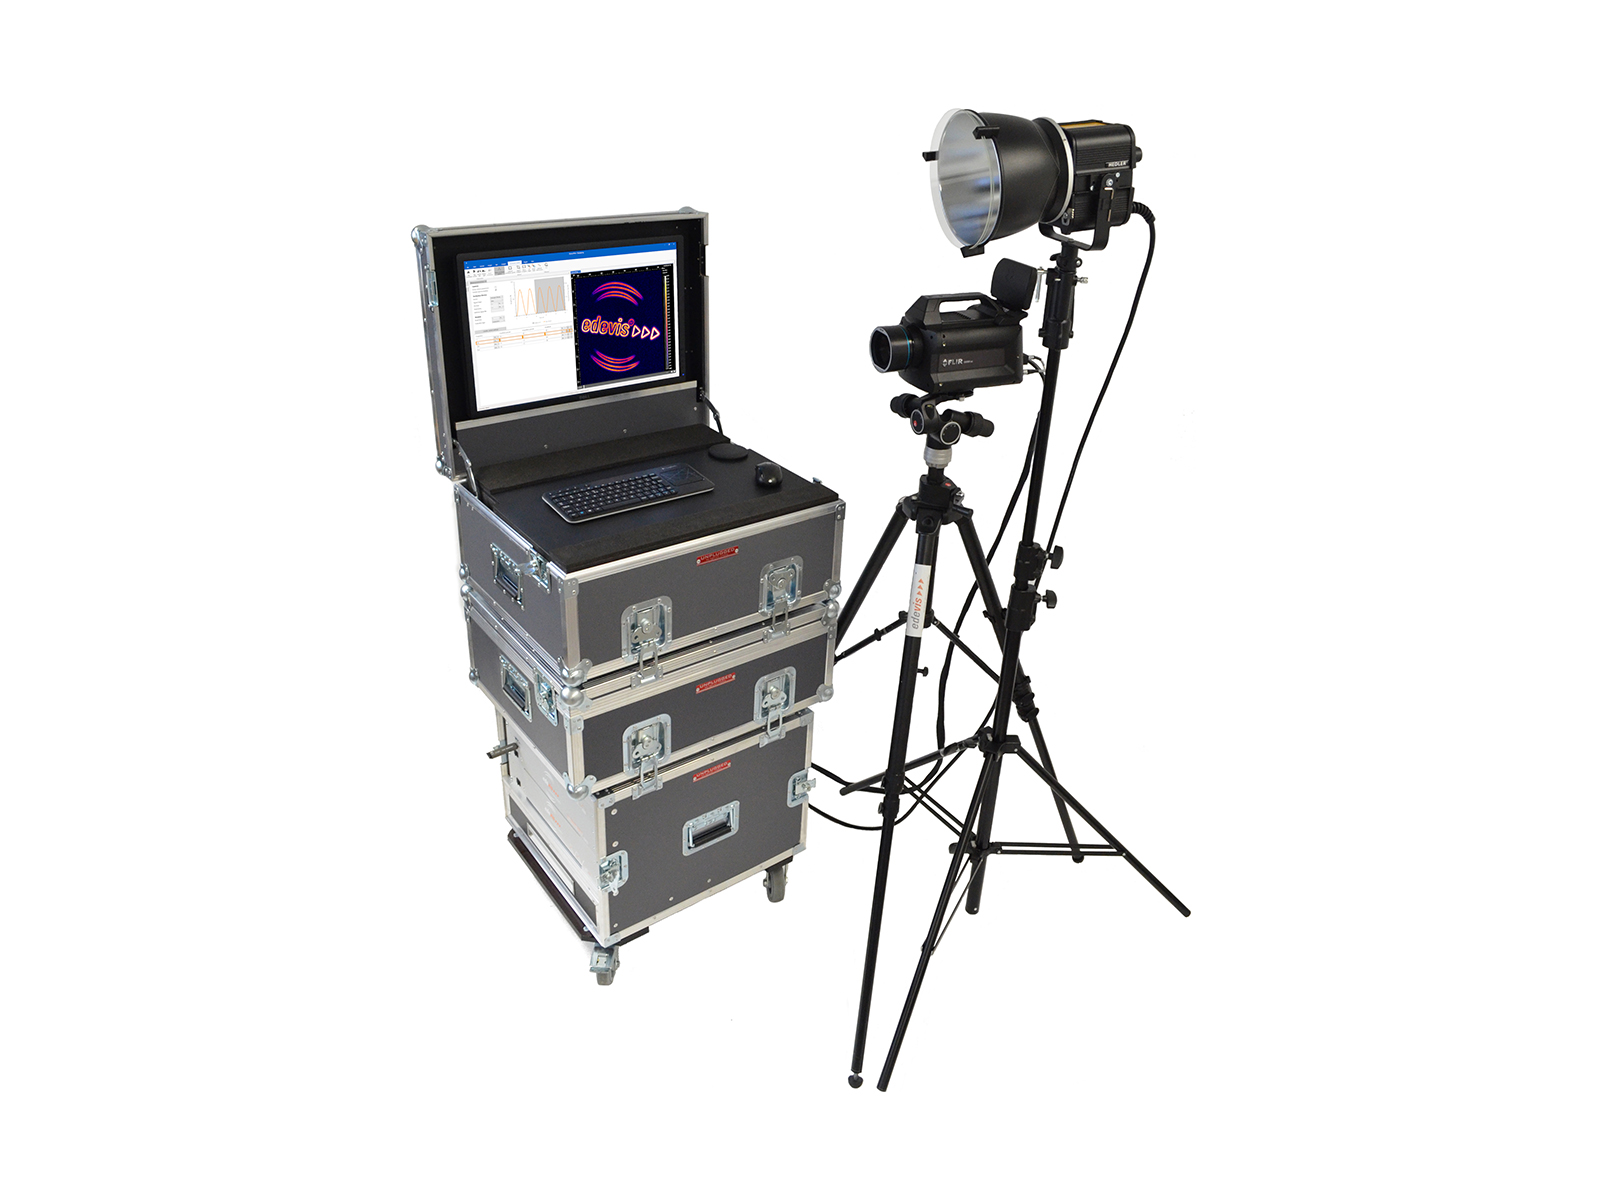
Optically excited lockin thermography is a non-contact, non-destructive testing method that is very well suited for characterising fibre-reinforced plastics (CFRP) in the aerospace and automotive industries. The method is particularly used when short measurement times are required. Large areas with complex geometry can be examined with one measurement. The Lockin technique is very robust and also works under difficult environmental conditions. The method is used in production as well as in maintenance. OTvis is expandable with all other Edevis excitation sources and software modules.
Principle of optically excited lockin-thermography
The optical lockin thermography (LIT) method is based on heat flow analysis. It is often referred to as heat flow thermography.
The surface of the object under investigation is heated with halogen lamps. The resulting heat flow into the material is altered by thermal obstacles such as impacts, delaminations or material thickness variations of the object. Thermal signatures form on the surface, which are captured by imaging with an infrared camera. The sensitivity of the method is very high due to the use of the lockin technique. The intensity of the halogen lamps is modulated sinusoidally and the surface temperature is recorded at the same time. A phase and amplitude image is calculated from the measured image sequence by means of a Fourier transformation. In the phase image, interference effects resulting from different emission coefficients or inhomogeneous excitation are significantly reduced. The statement about the interface state and/or the material thickness or the coating thickness is now possible.